Technical analysis: Bar charts | Blog Brings Profit For You
  • Recover Lost Money Plan

    A number of traders have lost their money in the market due to wrong trading advice or wrong decisions and emotions. We keep on getting a number of requests for helping these traders recover their lost money. Thus, this was the genesis of Recover Lost Money Plan. We are proud to say that till date we have helped 1290 people recover their lost money. Recover Lost Money in Market

  • Our Most Successful Intraday Tip

    Jackpot tip, as the name suggests has the potential to make you a Millionaire as it is not the number of tips one trades; but it is the accuracy of a single tip which has the potential to make you a Millionaire. This tip is a value for money for all i.e whether one can see the trading terminal or not or is dealing through a broker on phone at BSE, NSE or in Future and Options segment.
    Click on Jackpot Sure Shot Tip to know more...

Subscribe to this blog

Subscribe to full feed RSS
What is Daily Market State???
Enter your Email


Preview | Powered by FeedBlitz

Technical analysis: Bar charts

Posted By On 9/11/2008 11:59:00 PM Under

1. Bar charts are able to give reader more information to the readers as compared to line charts. The reason for this is a fact that one is able to have a look at the  open, high and low for the day.

2. One will be able to interpret in a better nmanner from the bar chart as one can visualise the meaning of red bar which means that stock has closed lower compared to previous close.

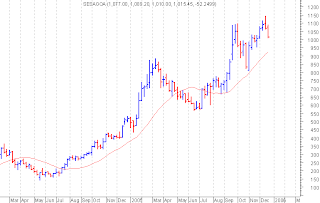
3. Moreover in case blue bar appears it means that stock has closed higher as compared to the  previous close.

4. It is worth noting that  "tick" on the left side is the open and the tick on the right side is the close.

Subscribe To Get Free Online Stock Market Technical AnalysisTips in Email Here

Enter your Email


Preview | Powered by FeedBlitz

Most Read Content